Pablo Cobo Pérez
About me:
- I live in Córdoba, Spain
- I have been practising kickboxing and hapkido in the past. I do gym for now
- I maintain a healthy diet. But that doesn't mean to never take some breaks!
- I'm very disciplinated, but I'm sometimes messy with my room
- Sometimes I overthink too much. That's why I try to do meditation.
- Never think that sucess is a luckly attribute, it's often attached to pain, that's why one of the biggest skills is resilence, by being solid and having time to disconnect even when you couldn't archieve what you wanted to get done that day.
- Never think that you're behind people.Comparing yourself to others is the worst thing to do, unless you learn from them instead. Social media, if abussed, can produce dopamine, making you consume more videos. If those videos show just the "perfect" aspect of people, you'll get caught in a cortisol (stress hormone) generation chain. Check my twitter thread.
Featured Work
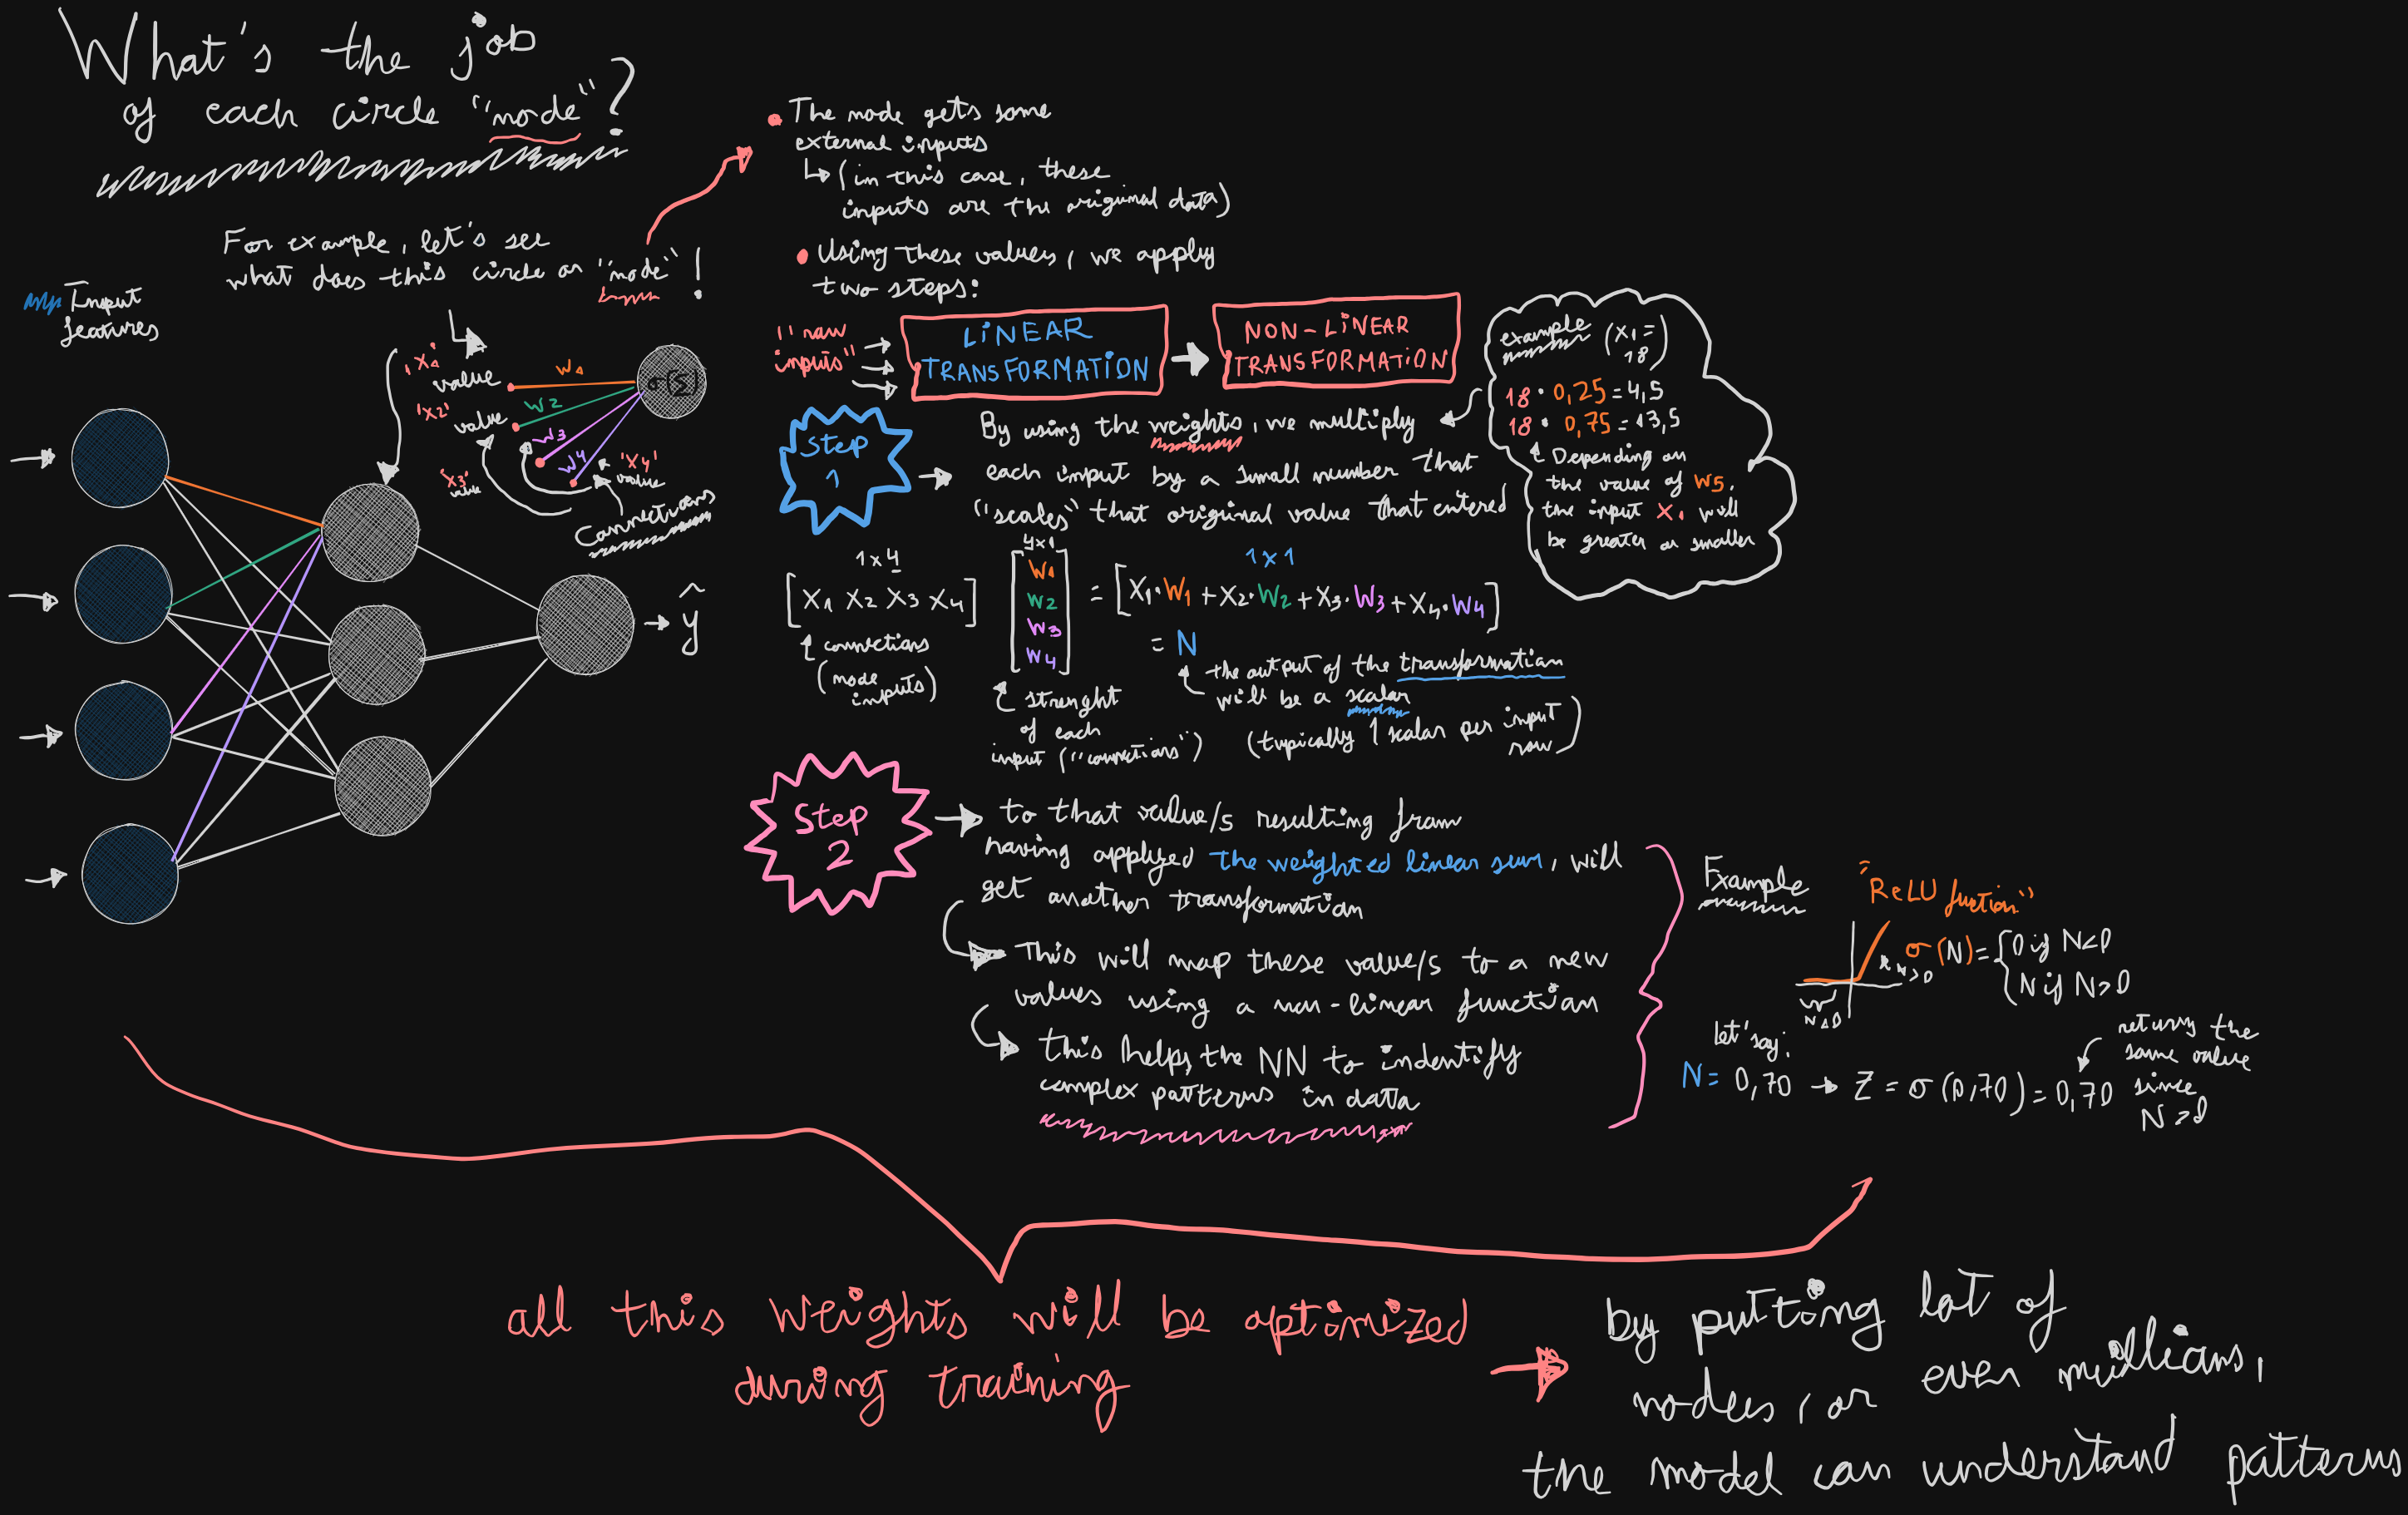
Neural Network ilustrated & coded from scratch: Here I made a handwritten + code guide of making a neural network from scratch. It was a result of an intense & funny summer I spent in 2023, learning all the core math of deep learning, helping me to solve high school errors and take a step further. I learnt:
- Calculus (derivatives, geometric interpretation, integrals and limits)
- Linear Algebra (arithmetic operations between matrices, vectors, scalars) and basic concepts like determinants
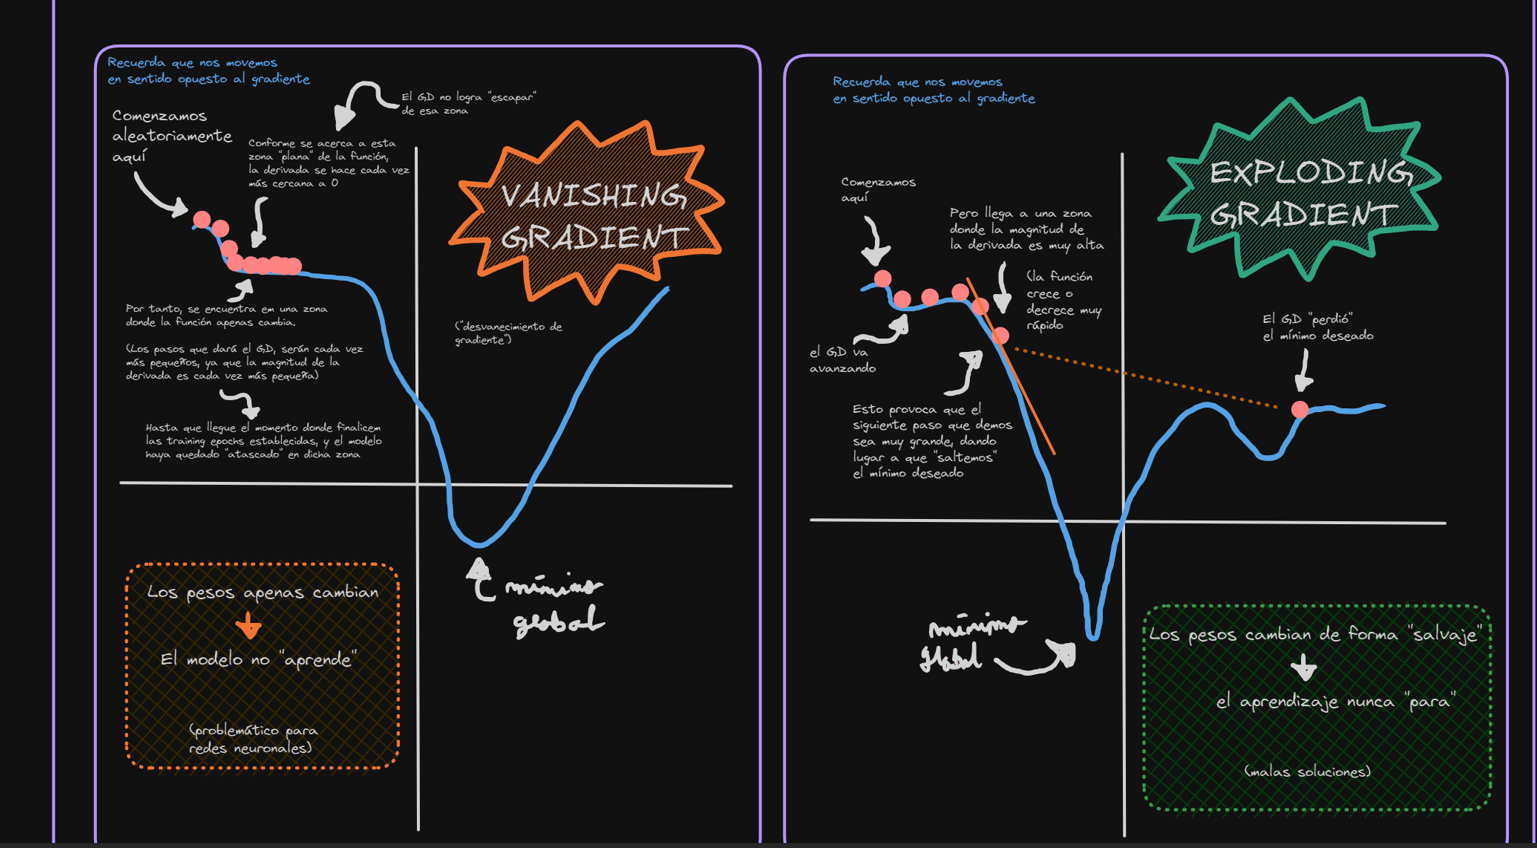
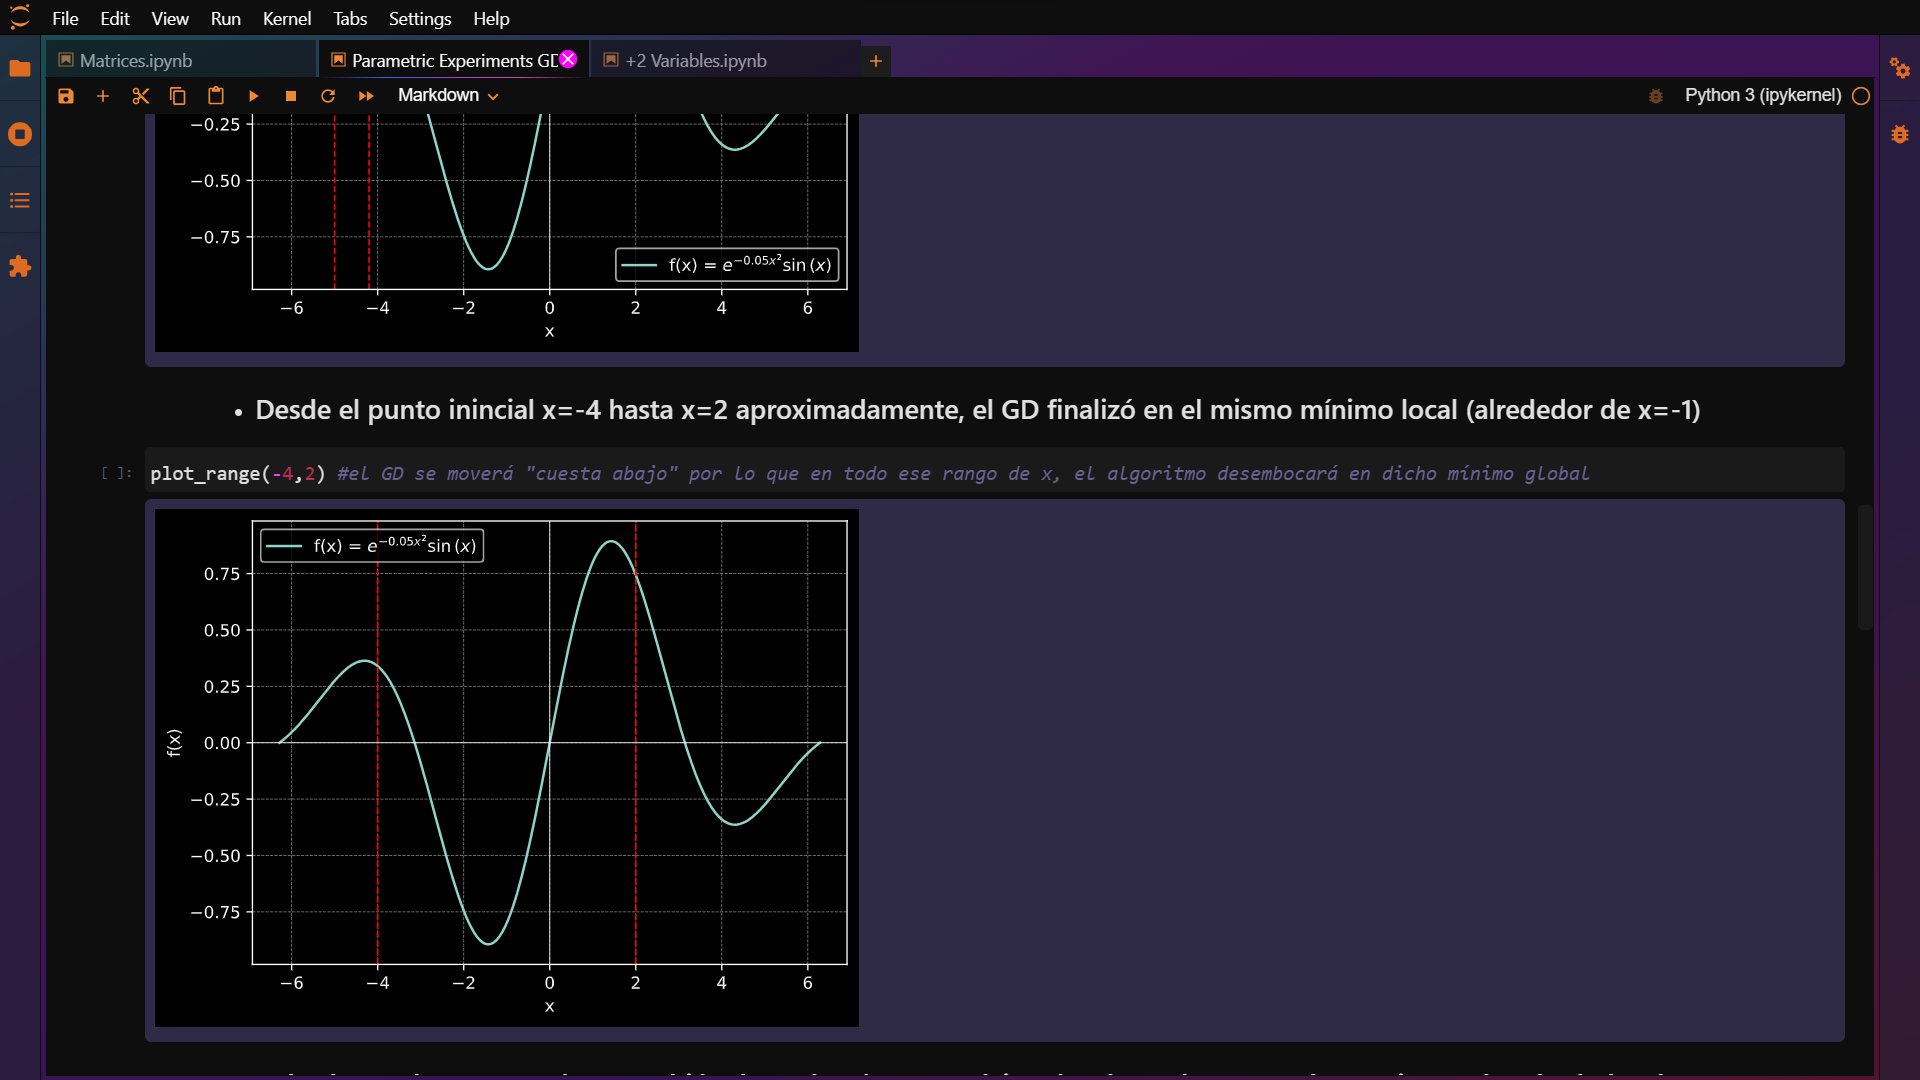
- Furthemore, solved some school concepts I used to confuse (like trigonometrics), by applying intuitive and interactive visualizations in python notebooks
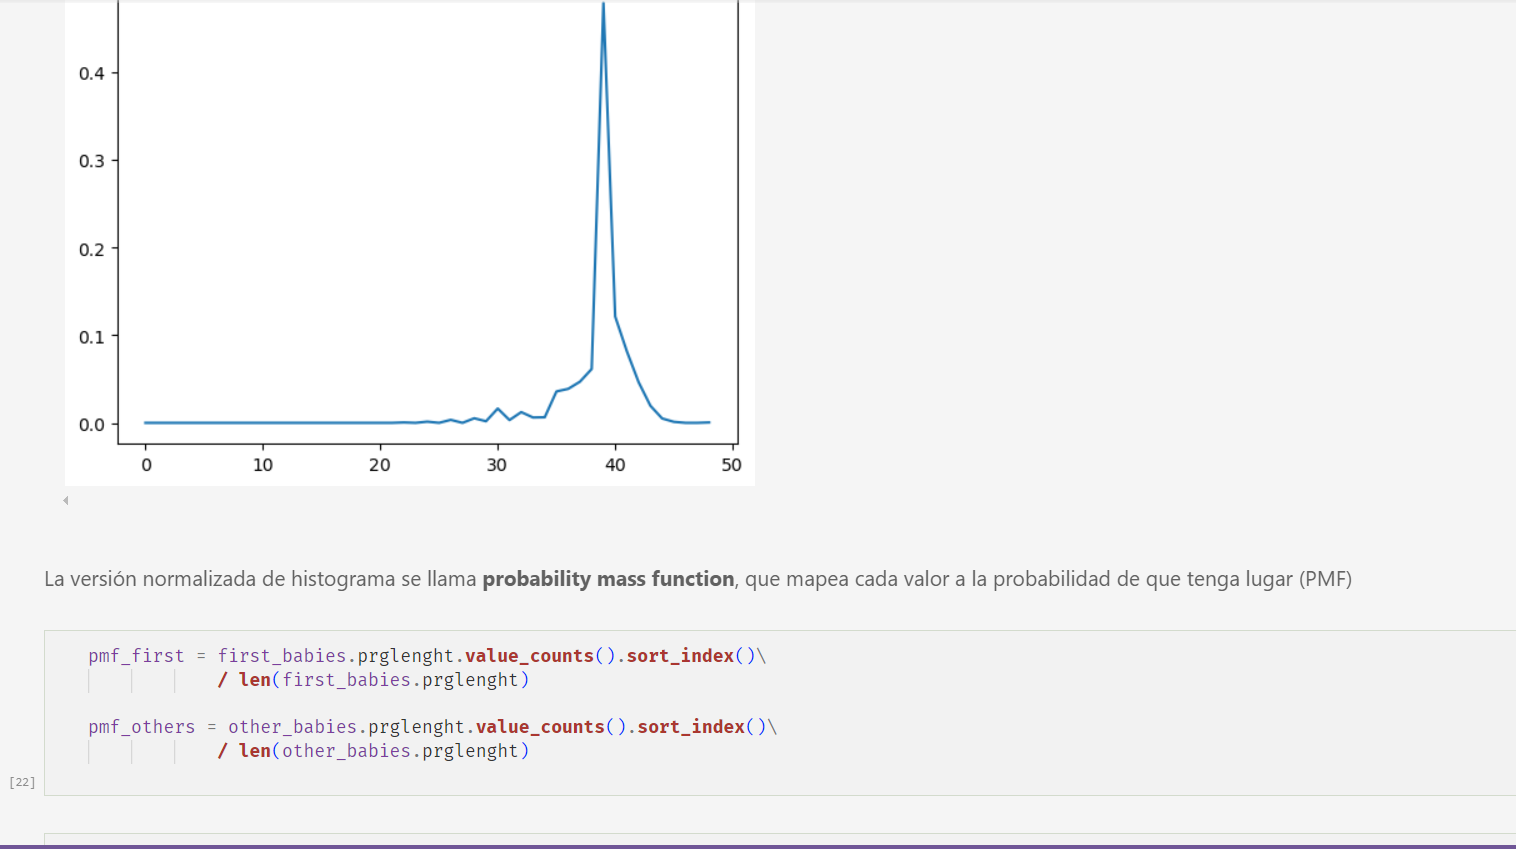
The following months after then, I also grasped the main concepts of Probability, and some statistics in python
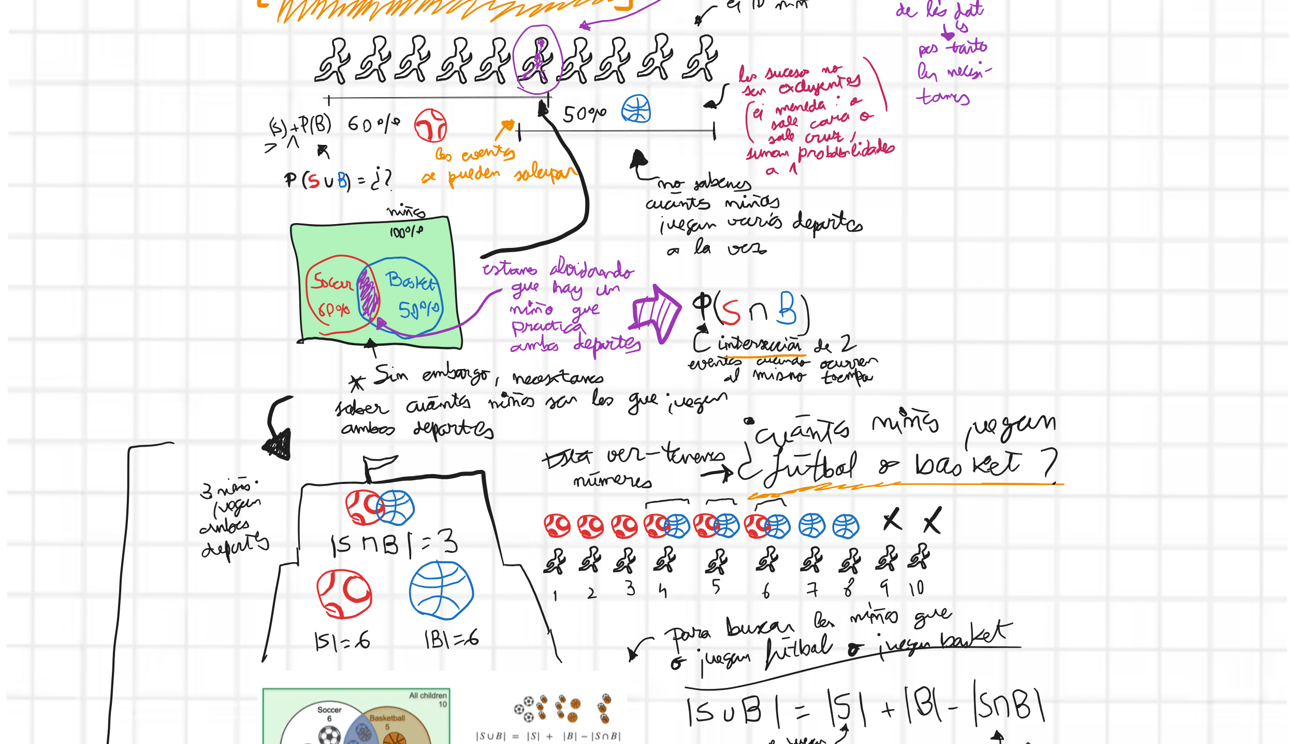
It helped me to really understand the art of neural networks, which I think it was the main block of abstraction in order to later understand new deep learning concepts (e.g convolutional nets or transformers)
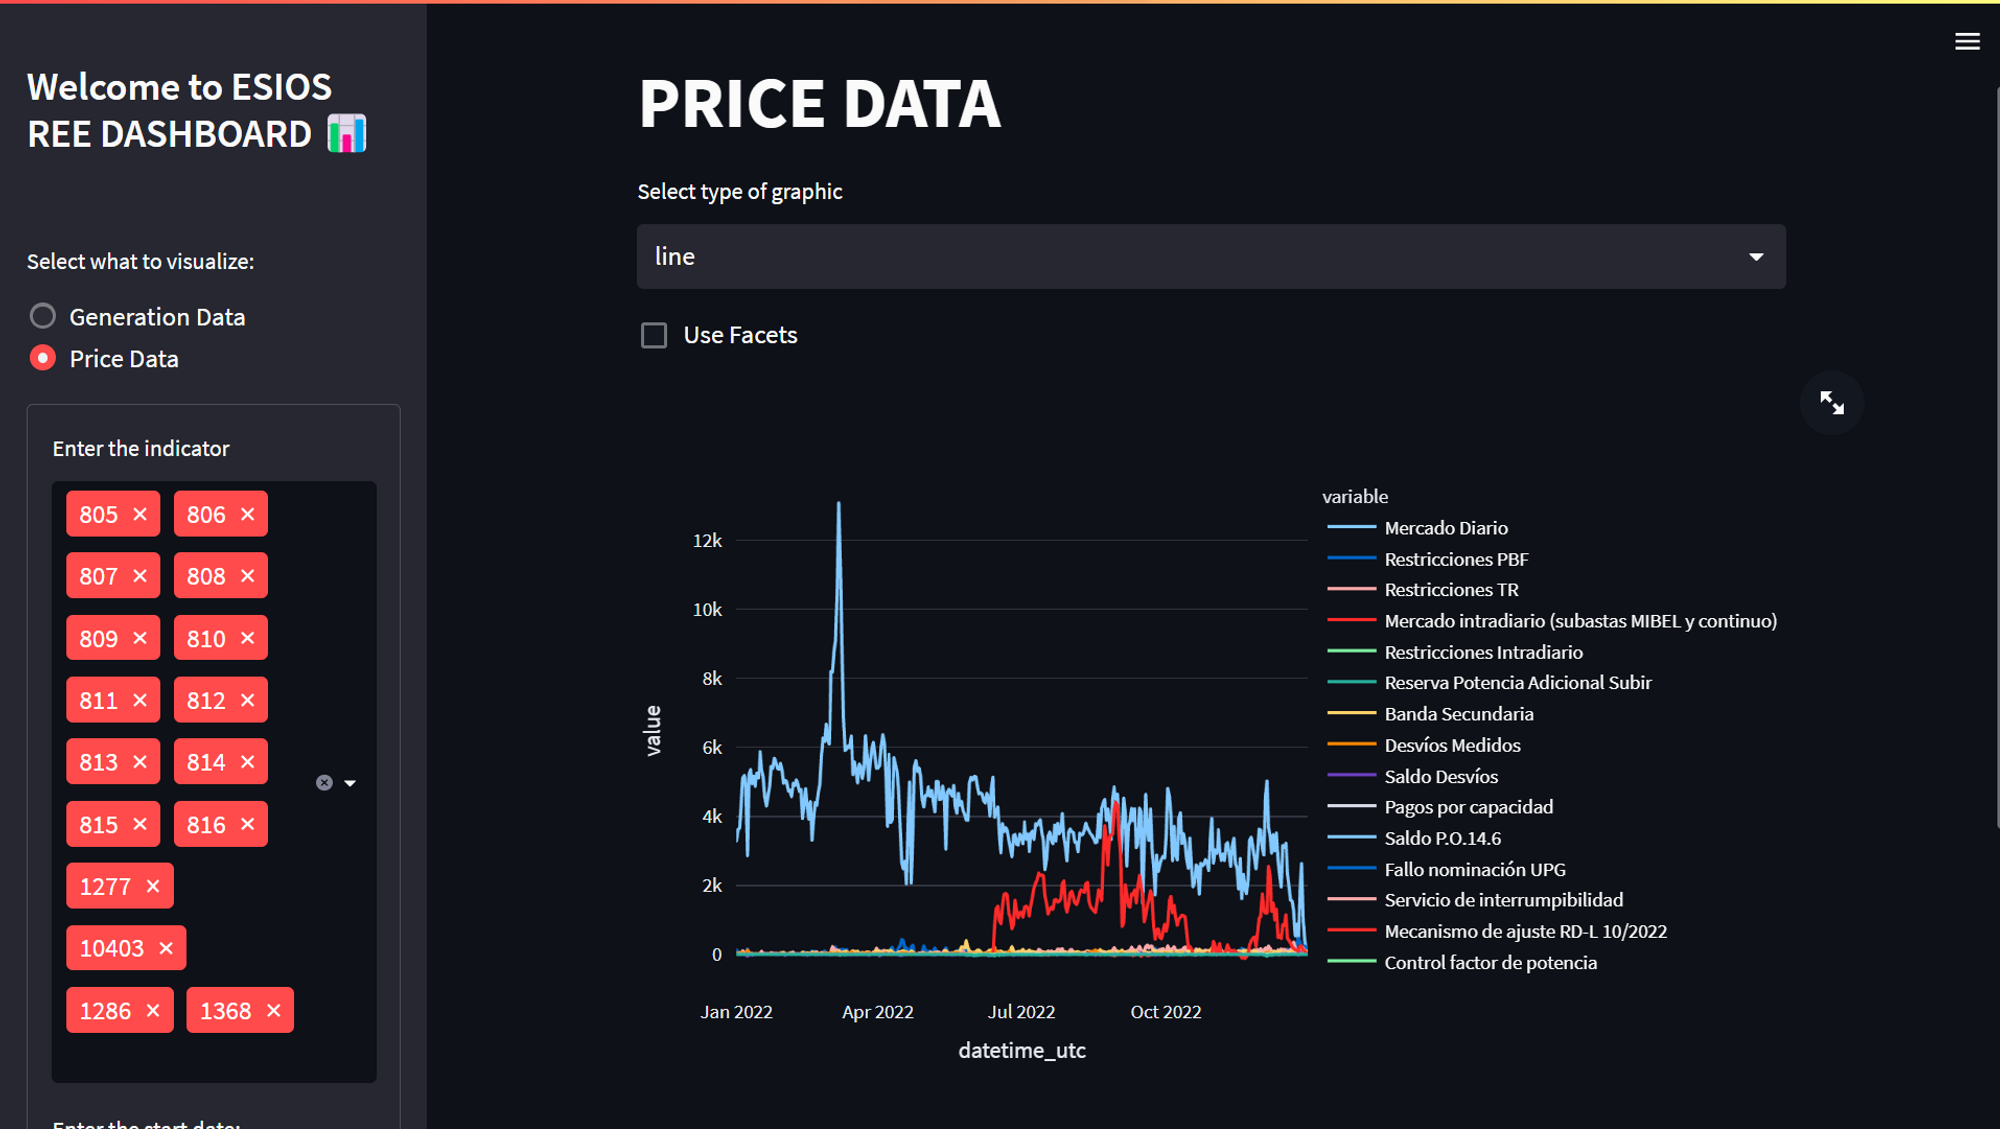
Real-Time Spanish Electricity Market Dashboard:
I built a visualization interface with the Python Framework called Streamlit.
It can analyze historical data of both generation & price of energetic generators in the market
- The data is retrieved from the ESIOS API
- Based on the user selection on the GUI, the app will display the data in different plot types
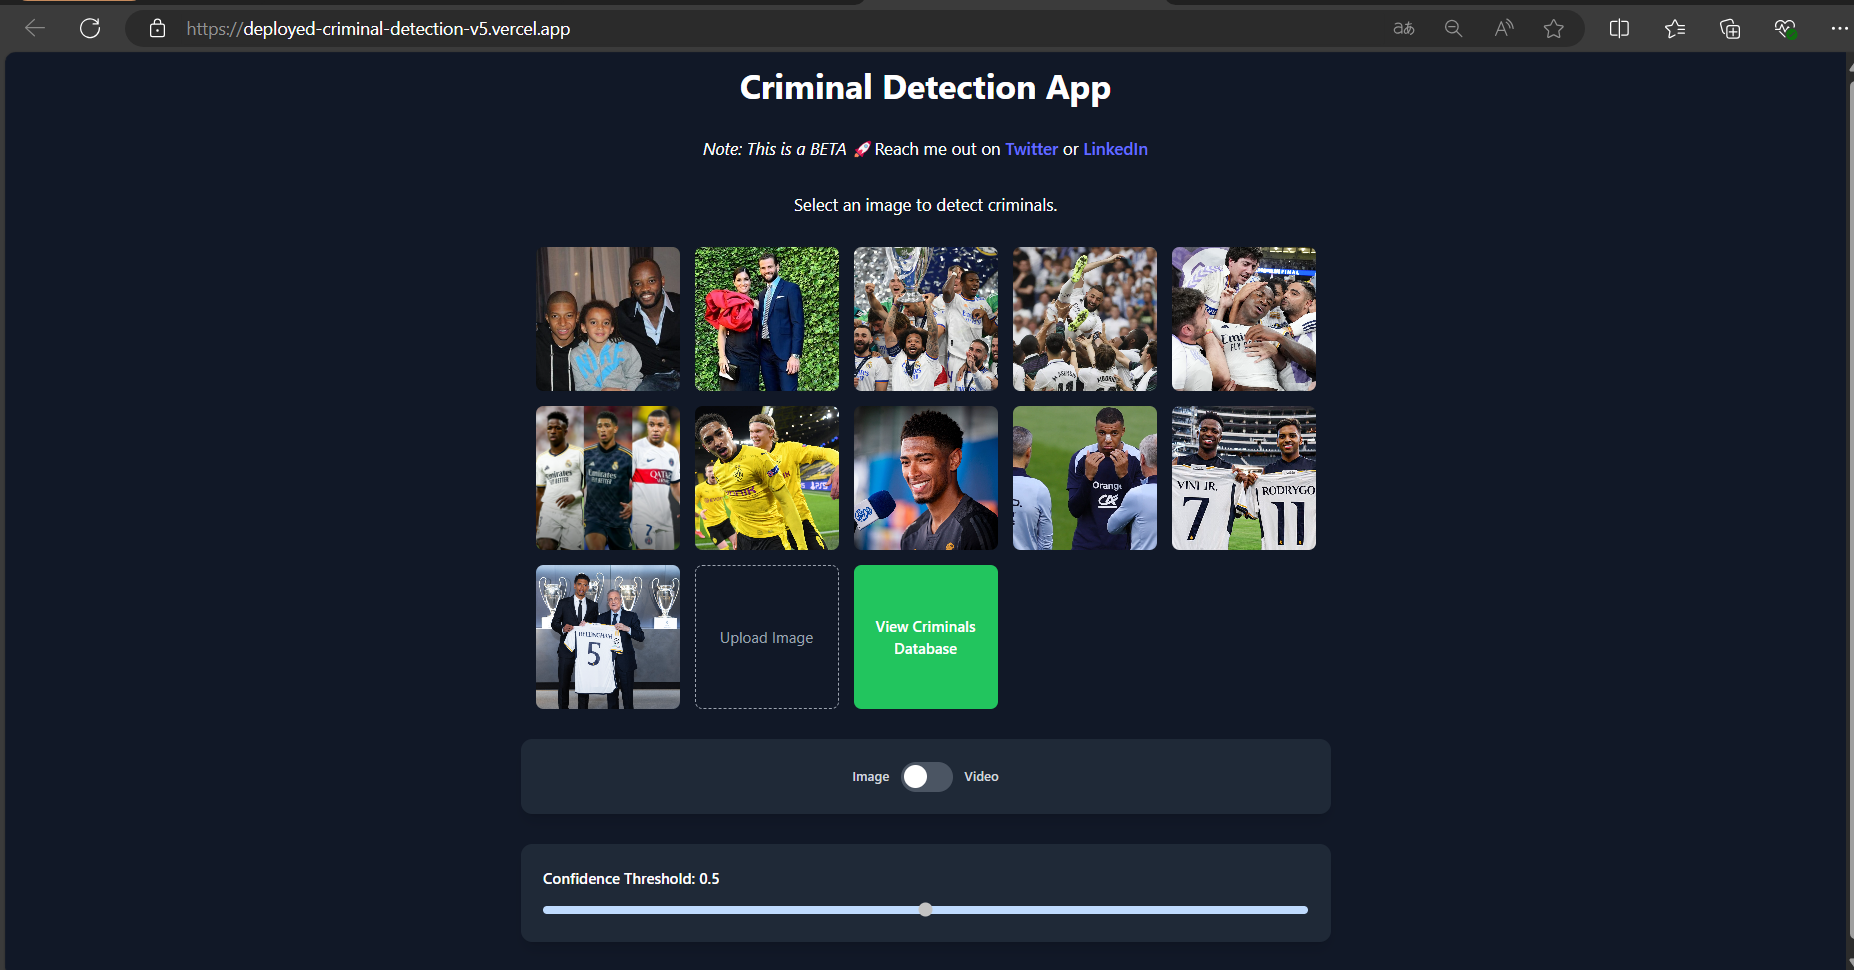
(Toy Beta) AI-Powered Criminal Detection in crowds: I made a toy version of a project whose aim was to help the police easily identify criminals in video footage without the tedious task of analyzing each second and comparing faces with their extensive database. It could be applied to security in homes & private companies. Started making a toy version, which combines an easy pipeline:
- Face Detector: crops the faces in the image/frame
- Face Recognition: extracts the intrinsic info of the face (embeddings) and compares them with the stored criminal faces
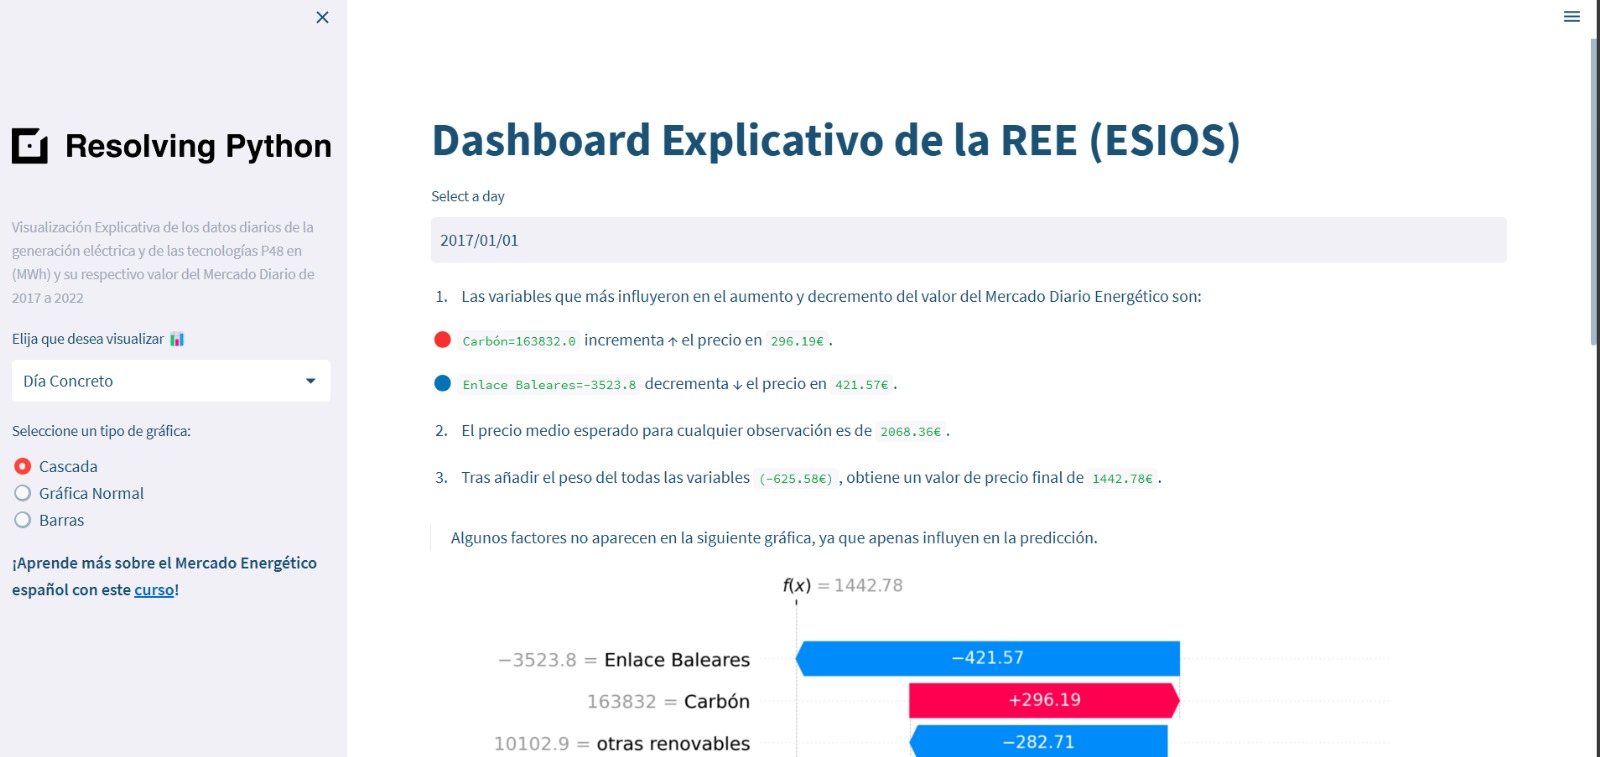
Historical Electricity Market Forecasting With the help of my mentor Jesus Lopez, I built a dashboard capable of giving accurate predictions of the electric data generation, as well as displaying it using shap to interpret its predictions. We trained the model on historical data of ESIOS Spanish Market API of 3 years (2017-2022)
- The data used for training was the daily generation of spanish energetic generators from 2017-2022 and it's value in the market.
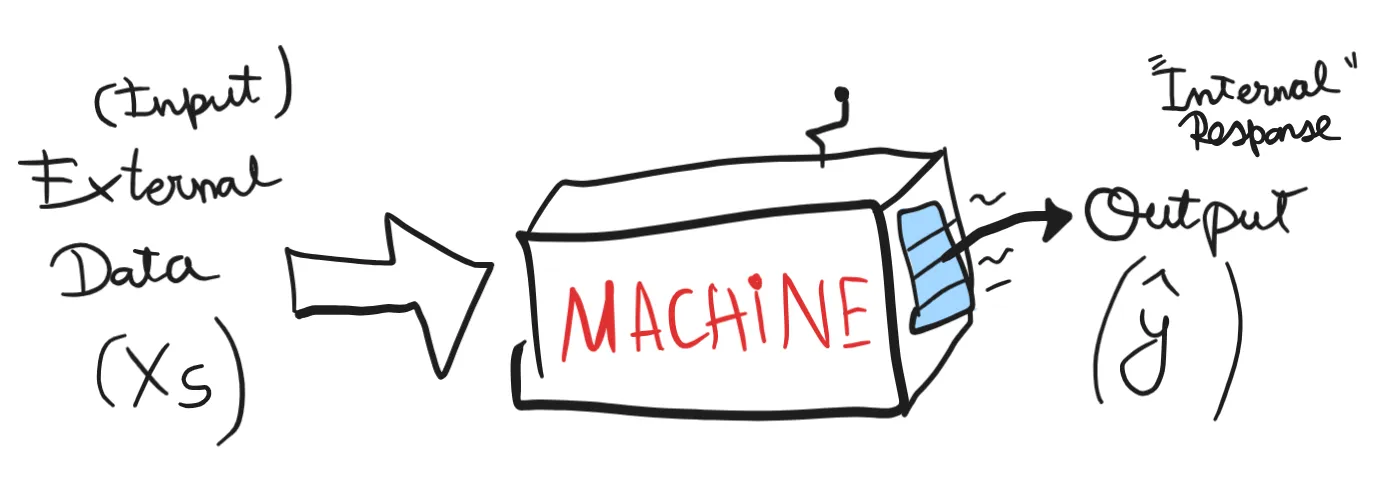
- The model takes as input the generation for each generator in a day, and gives the value of the energetic market for that input day
- After some explanatory data analysis, we observed that Solar PV , had a high Pearson correlation with the daily market end value, which made sense given the long hours of sunshine there are throughout the months in Spain.
- Selected the best suitable machine learning model for this regression problem, by comparing the mean squared error metric
- The model was deployed into a Streamlit web application.
- We decided to make the user interpret and understand the model predictions, getting key insights of the influence of each input variable to the prediction, by using the Shap framework
- We formatted the shapley values to let the user know how much did each input generator influenced to the market price of that day
- We combined this pure-english output with the rich visualizations that shapley offers.
- The potential use cases of this application includes the ability of giving the electric companies get accurate forecasting of which are the most strategic conditions in the energetic market with most return, giving them a easily interpretable insight of this kind of data, helping them to make the best data-driven decissions possible.
AI Explicative posts Few months after meeting my mentor, I started to implement an effective way to ensure I was correctly assembling the concepts I learnt along the way. It was about easily explaining them for others -- just like as Kaparthy said once: "You really know something, if you can explain it to a 7 years old"
Sample posts
Tweets
Tweets
I also learnt some Manim, a mathematical 3D animation framework made by the YouTube creator, 3Blue1Brown
By using Manim, I also explained some concepts I learnt along the way to build a project: